Home lab, automation and self-hosting

Hi there 馃憢 I鈥檓 Roland, a self-taught tinkerer focused on building gadgets, automation systems, and process control solutions. I brew beer, but the real interest is in measurement, repeatability, and continuously improving consistency from batch to batch.

That focus led me deeper into electronics, including heating and cooling systems, temperature control, and embedded hardware. I also run a home lab where I experiment with infrastructure, networking, and self-hosted services.

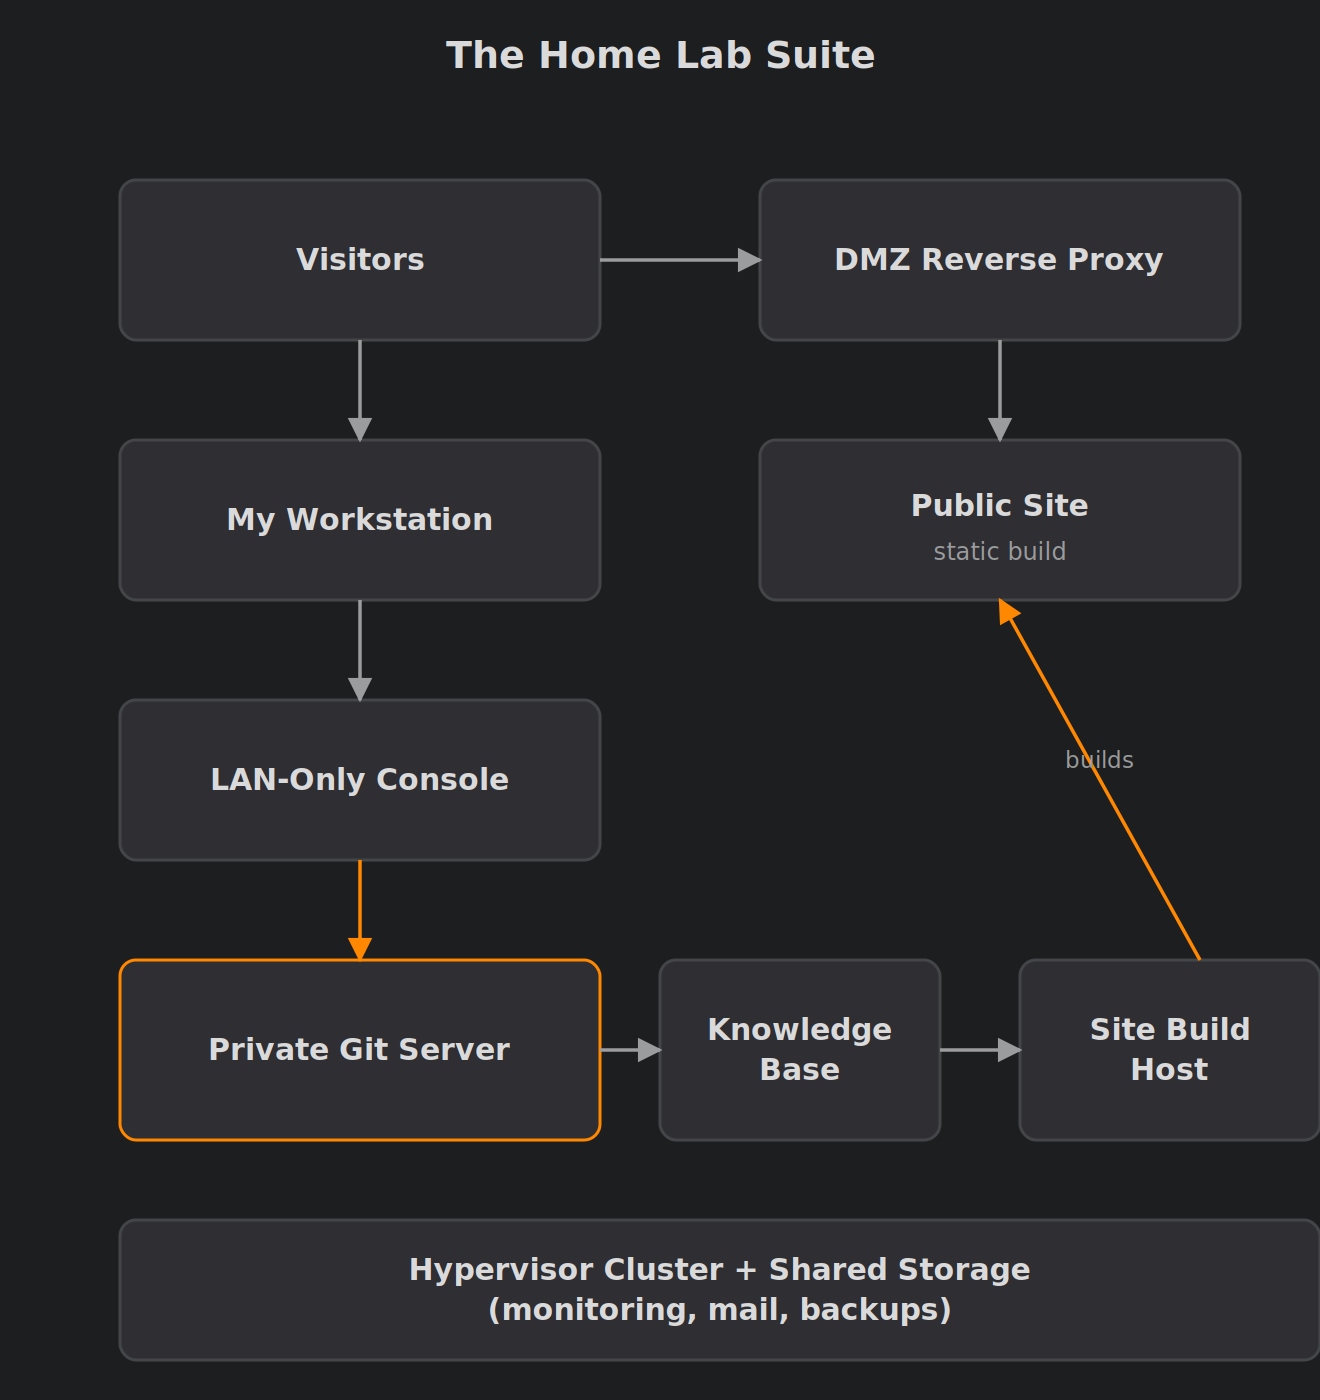
New here? Start with the guided tour of my home lab, which links every project write-up.
The wall dashboard showing the home lab status page: host tiles, cluster quorum, guests running and an empty alert list

MagicMirror虏 Wall Dashboard, Now With Home Lab Pages

A MagicMirror虏 dashboard with weather, Home Assistant, Spotify, news, stocks and webcams, now rotating through two read-only Grafana pages for the home lab. Covers the hardware history, the kiosk setup and how Grafana is embedded safely.

April 15, 2026 路 Updated October 7, 2026 路 16 min 路 Roland Hill
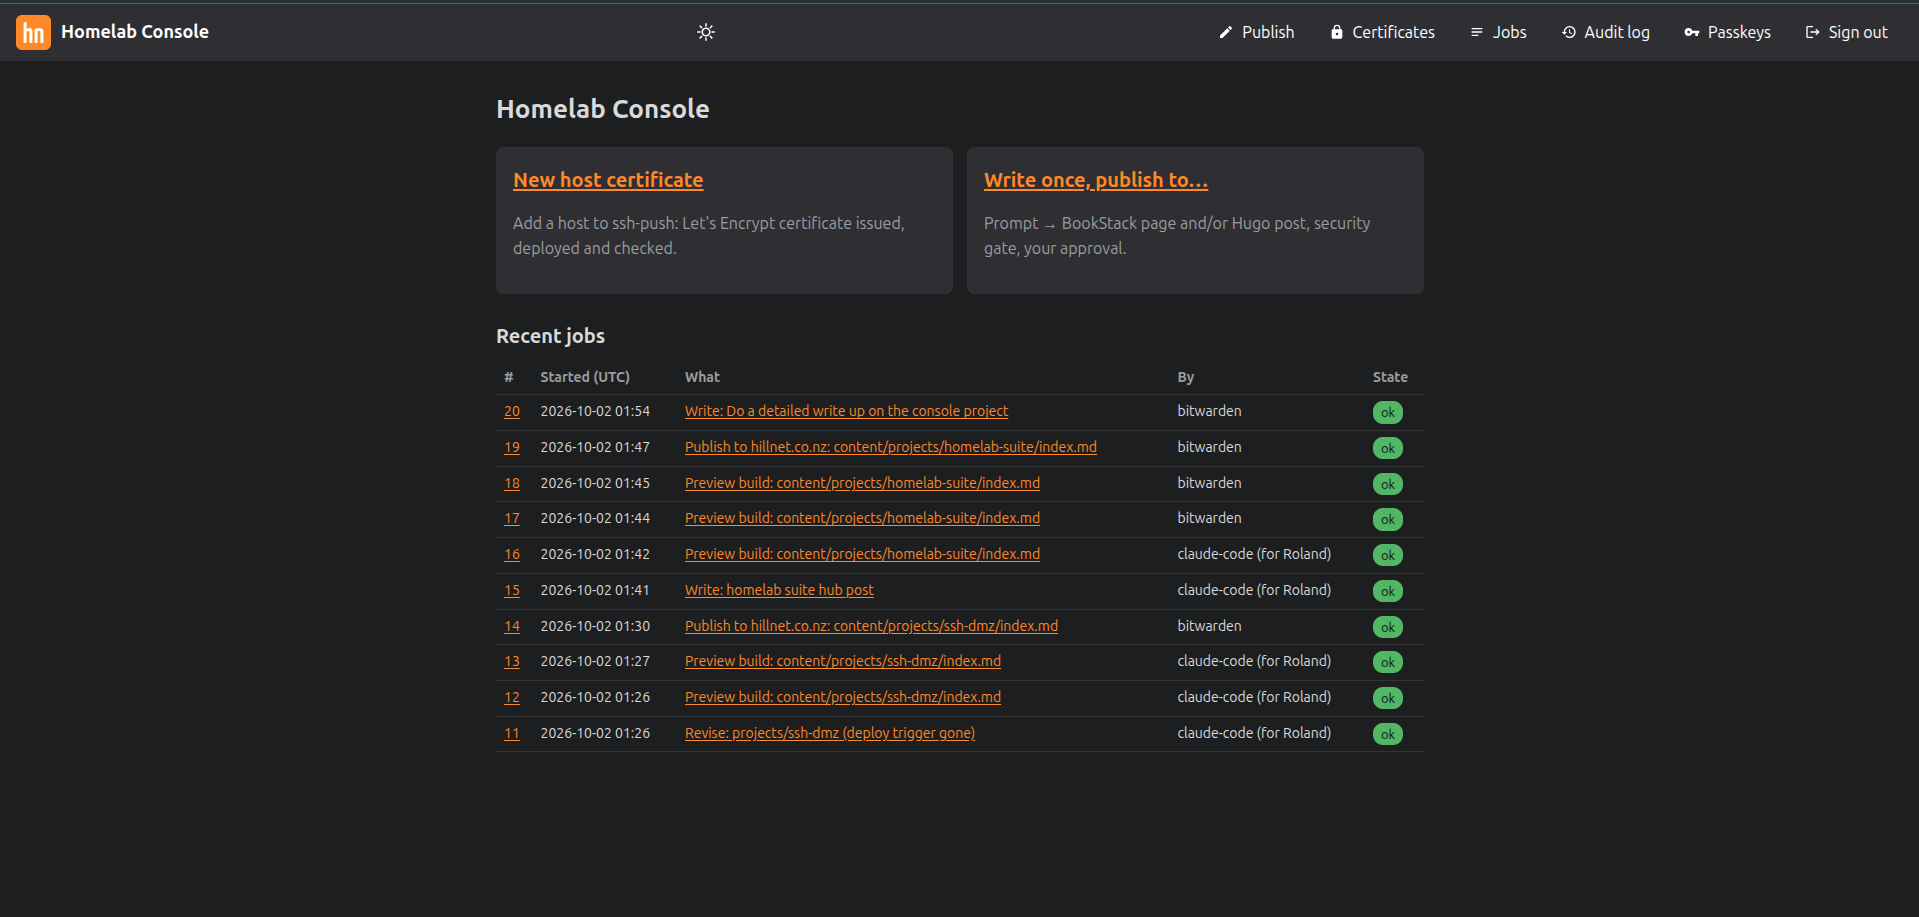
The Homelab Console dashboard in dark mode, showing Publish and Certificates actions and a recent jobs table

A LAN-Only Web Console for My Home Lab

The scripts I used to run by hand from my desktop now live behind a small LAN-only web console. It uses passkey sign-in and a fixed list of audited actions. Claude drafts pages, and a security gate checks them before I approve anything.

October 2, 2026 路 Updated October 4, 2026 路 8 min 路 Roland Hill
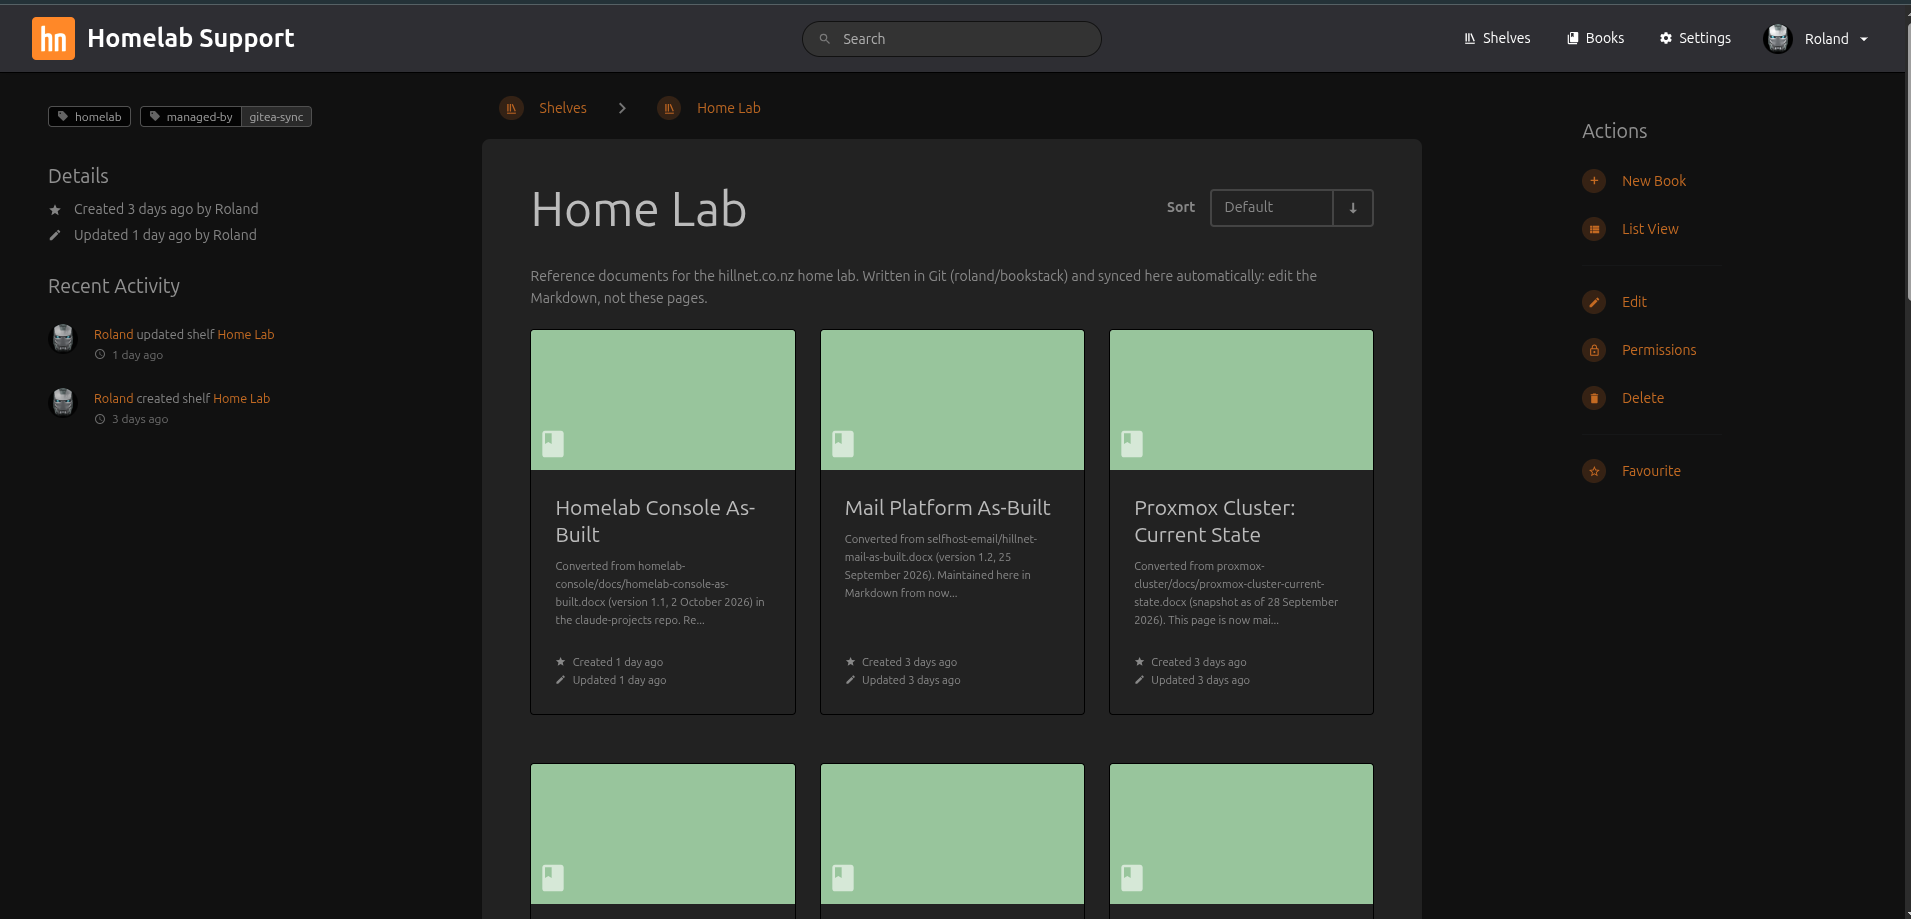
The BookStack Home Lab shelf showing several synced reference books

A Git-Backed Home Lab Knowledge Base with BookStack

How I built an internal BookStack knowledge base where Markdown in a private Git repo is the source of truth, synced automatically by Gitea Actions, with public posts derived only by a manual, reviewed step.

October 1, 2026 路 Updated October 4, 2026 路 7 min 路 Roland Hill
A Grafana Node Exporter Full dashboard showing CPU, memory, network and disk usage

Homelab Monitoring with Grafana, Loki, Prometheus and Alloy

How I centralised logs and metrics for my homelab with Grafana, Loki, Prometheus and Grafana Alloy, and what I learned about push-based collection, alerting and code-generated dashboards.

October 1, 2026 路 Updated October 4, 2026 路 9 min 路 Roland Hill
The Matomo analytics dashboard showing visits over time and a visitor map of New Zealand

Self-Hosted Matomo Behind a Reverse Proxy

How I self-host Matomo analytics for a static Hugo site. Matomo stays on an internal server, and a DMZ reverse proxy carries the tracking traffic, with the real visitor IP and GeoLite2 geolocation preserved.

October 1, 2026 路 Updated October 4, 2026 路 6 min 路 Roland Hill